How an integrated analytics solution can benefit your business

Digital & Technology


356 week ago — 10 min read
Summary: Data Analytics is a buzzword these days. To understand how to get the right insights from data and apply them, Lester Fernandes explains the ‘BUDSTA Framework’. Read further to learn more about this approach to analytics, that enables actionable insights.
Data Analytics is the science of investigating data to discover user patterns, behaviours and other valuable insights. It is no exaggeration to say that Analytics and the closely related Data Science are the prerequisites for informed business decisions. In the words of W. Edwards Deming, widely acknowledged as the leading management thinker in the field of quality — 'In God we trust; all others bring data.'
Effective analytics solutions require the integrated operating of three vastly different mindsets working together in unison. These perspectives then collectively create a customised solution tailored to specific business needs of the organisation. The BUDSTA© analytics framework represents the coming together of these different mindsets to be the guiding foundation for well thought through and jointly formulated analytic solutions. BUDSTA©, very simply put, is an acronym for: 1) Business Understanding 2) Data Science and 3) Technology Acumen.
BUDSTA Integrated Analytics Framework
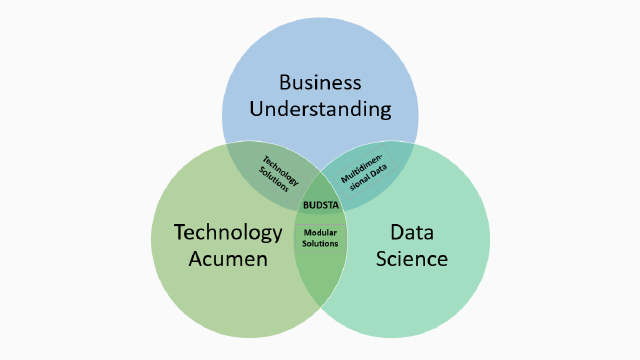
The detailed explanation of these mindsets is as follows:
1. Business Understanding
What is our understanding of the data that is provided or will be required to formulate the business need that the analytics solution should address? Answering this question typically requires experts from the specific industry who have an intricate knowledge of the business. For example, a Bank will have a totally different view of a customer as opposed to that of a telecom provider. The Bank will be interested in the overall credit worthiness, educational qualifications, locality, etc. to name a few attributes. On the other hand, the Telecom provider will be interested in the credit worthiness towards the monthly bill amount, the tendency to make calls/ consume data, the likelihood of switching to a competitor, etc. We need to frame the problem from the business perspective and accurately understand details of the data pertaining to that specific industry. This, in turn, will help to properly identify the questions that need to be answered from the Analytics viewpoint.
Other aspects that differ vastly across Industries – to name a few – are the Value Chain and Customers, Input Costs, Supply Chain, Market Dynamics and Stakeholders, Geographic Area, etc. These aspects are not exhaustive and could vary very significantly sometimes within competitors of the same industry. For example, sudden drop in existing Telecom revenues could be due to a new entrant – Reliance Jio capturing the Indian market with its disruptive pricing model during the 2016-17 timeframe for certain metro cities. Any trending variance during this period could only be attributed to this change all other factors remaining the same. Similarly, the banking industry had significantly increased customer deposits during the end of year 2016 due to demonetization and withdrawal of the existing currency notes. This also led to a spurt in withdrawals at the same time to account for the shortage.
2. Data Science
What is the necessary data and the related statistical and decision analysis that will result in the correct solution? The Data Scientist typically starts with identifying the business objective that is sought from the data – typically in conjunction with Business Understanding as outlined above. The correct statistical knowledge is then brought into the mix to ensure that the business objective will be correctly met. This is a relatively new and continuously evolving area because of the advent of technology that makes the underlying statistical analysis comparatively easier. The desirable outcome from this mindset is the application of statistical knowhow to the business problem and identification of the models and related data that will be used to solve them. A qualified judgement will be required at the end of this phase to zero in on the identified solution with its related accuracy and relevant benefits/disadvantages. This is then relayed back for the business to validate and close on the final decision.
Let us take a simple example – an insurance company aspiring to identify fraudulent claims given the vast data that it already possesses. The Data Scientist first frames with the Business what the characteristics of a fraudulent claim are and how a seasoned investigator can identify these – find the proverbial needle in the haystack. Core to the solution will be the understanding that you will need to integrate the customer and claim data along with the claim history for that specific customer. The integration of various data sources – bringing about a rich view of a previously standalone claim – in short, the multidimensionality of data to address the question at hand will be the starting point. After the necessary data cleansing, various models can be utilised to identify the fraudulent claims ranging from a simple Decision Tree to a complex Machine Learning algorithm using neural networks. Selection of the model based on accuracy and speed along with the validation on real data should be the Data Scientist’s responsibility. As an example, an insurance company with 5% fraudulent claims, any model will be 95% accurate if it blindly accepts all claims, but it will be useless for the purpose of fraud investigation.
Another application is in the field of medical science – Radiology – for example, to identify correctly a fracture in a bone or a tumour in the brain. After the identifying factors in the image correctly classifying the particular ailment have been recognised by the radiologists, who clearly know what they are looking for in the image, the Data Scientist can quickly create a model that starts learning and refining its decision making based on training. Once again, the key is the ability to quickly generate insights from the available imaging data speeding up the process of informed diagnosis in partnership with the radiologists.
3. Technology Acumen
How will the relevant data be collected? At what frequency should that data be made available for determining the analytics solution? The Technologist is typically engaged at the point of determining where the data is currently available and how it can be brought into an integrated Business Intelligence System for the analytics to begin. After a model is selected for analytics decision making, the Technologist is usually engaged to operationalise the model, make the decision outputs available to various stakeholders and refine the model in subsequent iterations. Additionally, with data streaming in from various sources including social media, it is the Technologist who decides how the data is addressed with all its volume, velocity, variety, veracity and value implications (Big Data).
The Technologist is also responsible to ensure that the model is composed of reusable modular blocks so that newer models can be quickly developed for addressing a similar class of business analysis. Identifying the high-level approach – namely that of Open Source or proprietary software to give the expected results and ensuring the Return on Investment (ROI) and Total Cost of Operations (TCO) for the chosen approach also falls in the domain of the Technologist in conjunction with the business and data scientist. Given the abundance of research insights into the various improvements offered by subsequent refinement of mathematical and statistical analysis makes it imperative for the Technologist to continuously refresh the processing steps and validate the results with inputs from stakeholders in every change – namely, the business and data scientist.
An example of Technology Acumen will be in government analysis of Business activity – layering the various taxable revenues over a geo-spatial map and subsequently measuring the efficiency of each local government with metrics easily visible in dashboards to stakeholders. Another example would be in the Retail Space, where transactions are processed at Point of Sale (POS) systems, assimilated and then further processed technologically for Market Basket Analysis (Increase in Sales), Loyalty Programmes and Inventory Optimisation – to name a few use cases.
To conclude, integrating and incorporating intelligence from the three different mindsets facilitate in formulating a complete analytics solution. Addressing any subset of the required three dimensions results in a temporary, ineffective or irrelevant analytics solution that will further see a monumental challenge in conveying the solution to organisational stakeholders and deriving the maximum insights from their concurrence.
The BUDSTA framework ensures an effective, efficient and lasting analytics solution that meets all stakeholder’s explicitly stated Analytics requirements. This is an integral part of our organisation’s analytics training, value frameworks and customer tailored solutions across all our engagements.
To explore business opportunities, link with us by clicking on the 'Invite' button on my eBiz Card.
Disclaimer: The views and opinions expressed in this article are those of the author and do not necessarily reflect the views, official policy or position of GlobalLinker.
Posted by
Lester Sebastiao FernandesI am looking to connect with other business owners who need to extract analytical insights from current data and take informed decisions. We make your Data Insights journey easier...
View Lester 's profile
Other articles written by Lester Fernandes


Technology & business trends: 2019 & beyond
326 week ago
Most read this week

Trending
Ecommerce 3 days ago
Comments
Share this content
Please login or Register to join the discussion